3.4 PER MILLION BY DOUGLAS P. MADER
The Right Decision
Use economic value added metric for project selection
AS THE SIX SIGMA Academy led large deployments at Allied Signal, General Electric and other organizations in the 1990's, one of the great benefits realized was linking define, measure, analyze, improve and control (DMAIC)-based project improvement to financial performance. The simple idea of focusing on hard savings—results that would make a difference to the bottom line in the current year—crystallized for senior managers at many organizations and gave them the motivation to risk resources and focus on Six Sigma deployment. Focus on financial results allowed organizations to integrate improvement goals in policy deployment systems, which made a huge difference in the success of Six Sigma deployments for early adopters.
A problem with this highly successful idea was that most companies were pushed hard by consultants to focus exclusively on hard savings, and little heed was paid to soft savings—improvements that did not necessarily have an effect on the current-year bottom line. As I have argued previously, it is completely normal and expected for hard savings per project to decline as Six Sigma deployments mature.1
The reason for the decline? You will have fewer opportunities for improvement as you make improvements over time. Based on my experience, most manufacturing organizations would see a hard savings of $300,000 per project in the first year by Six Sigma deployment. By the third year, savings per project would be $75,000. Some naive managers think this decline means Six Sigma has lost its effectiveness or that a programmatic change is in order. Nothing could be further from the truth. The decline simply implies the organization is solving problems faster than it is creating them. The organization in question should really start to focus Six Sigma resources on product and process development instead of cannibalizing the program.
An additional consideration is that there may be tremendous untapped opportunity for improvement, but that opportunity may lie in the area of soft savings, which might include inventory, cost avoidance, risk reduction or other non-expense items. As they deploy lean Six Sigma, organizations should consider quantifying the available opportunities for improvement so all areas can be identified and ranked for a sound project selection method.2
Enter EVA metric
In my experience working with Six Sigma, I have been using a financial metric called economic value added (EVA), which was developed by the Stern Stewart Co., to evaluate publicly traded companies as potential investments. A close look at this metric and a related metric called delta EVA will show you how to evaluate potential projects involving hard savings alongside projects involving soft savings. According to Stern Stewart, EVA is defined as follows:
EVA = NOPAT - {WACC x (TA - FL)}
NOPAT stands for net operating profit after tax, WACC for weighted average cost of capital, TA for total assets and FL for free liabilities. The only quantity in the equation not typically found in publicly traded companies’ financial reports and statements is WACC, which represents a weighted interest rate that is associated with the debt and equity structure for the company.
For example, if a company holds $3 million of debt payable at 10% and $1 million of equity with a return of 20%, the WACC is 0.75 x 0.1 + 0.25 x 0.2 = 0.125, or 12.5%, in which 0.75 represents the proportion of debt to total debt and equity, and 0.25 represents the proportion of equity to total debt and equity.
The portion of the formula shown in brackets is also known as the capital charge. You can think of the capital charge as the amount of money that should be paid to investors as a dividend for the use of their money. Total assets minus free li-abilities gives an estimate of the amount of money that has been used by the company. This is known as capital employed. Applying an interest rate based on debt and equity to the capital employed provides you with an estimate of what might be considered a fair return to the shareholders.
If you then subtract the capital charge from the NOPAT and get a negative EVA, it means you did not achieve enough profit to cover the estimated dividend, even though the company may well have turned a profit. This scenario is likely to result in a falling share price. If EVA is positive, however, it means your profit level was large enough to cover a fair return to the shareholder. The EVA estimates how much cash would be available to fund reinvestment and other activities that the shareholder will view positively.
Dealing with delta
Many people and organizations have realized this metric can play a powerful role in helping select worthwhile improvement projects—whether they are Six Sigma projects, “just do it” projects or any other improvement activity. You need to consider how much EVA will change if you are successful with the project. The metric you would use, therefore, is called delta EVA. Delta EVA is defined as: the corporate tax rate, and the Δ symbol represents that change in the respective quantity. For ΔNOPAT, ΔTA and ΔFL, use a positive number if the quantity will increase relative to the current value. Use a negative number if the quantity will decrease relative to the current value as a result of the improvement project. This formula can be easily programmed in a spreadsheet for project selection.
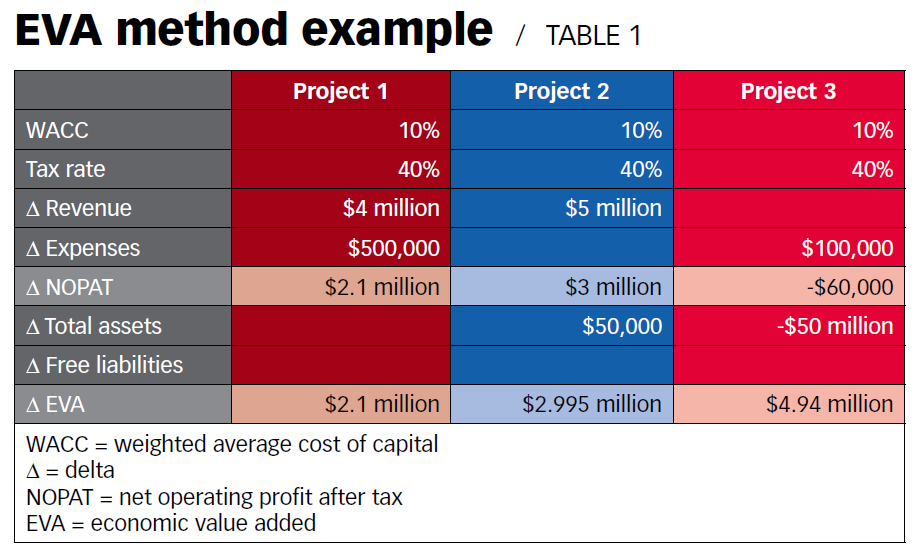
To illustrate the method, consider the following example. Suppose an organization has a corporate tax rate of 40% and a WACC of 10%. Its lean Six Sigma project selection committee is considering three potential improvement projects. The first project involves a $4 million revenue increase by performing a voice of customer study, which will cost $500,000. The second project entails a $5 million expense reduction in manufacturing and involves purchasing new equipment for $50,000. The third project involves a $50 million inventory reduction and will cost $100,000 to implement. See Table 1 for a breakdown. Given the limited information provided in the scenario, all three projects are worth-while to pursue. It is interesting to note that the traditional focus on hard savings would have excluded project 3, even though it had the best overall contribution to EVA.
Risk and return
With simple metrics such as EVA, it is possible for an organization to compare projects with differing levels of hard and soft savings, as well as revenue enhancements. This method has proven invaluable for many who need to choose the right lean Six Sigma projects based on financial im-pact, strategic value and customer impact.
The delta EVA metric is also exception-ally easy to use because it does not rely on having current financial numbers, with the exception of the corporate tax rate and the WACC. Black Belts, as well as Green Belts, can perform these computations easily with occasional help from Master Black Belts and financial personnel. When coupled with risk analysis—based on a qualitative risk metric that can be applied across many projects—a risk vs. return plot can be generated. This allows Champions to easily manage a portfolio of lean Six Sigma projects and properly allocate resources. For these reasons, the EVA and delta EVA concepts should be incorporated into standard certification curricula.
REFERENCES
1. Douglas P. Mader, “What Comes After the Low Hanging Fruit?” Quality Progress, August 2008, pp. 58-60.
2. Douglas P. Mader, “How to Identify and Select Lean Six Sigma Projects," Quality Progress, July 2007, pp. 58-60.
BIBLIOGRAPHY
Stewart, G. Bennet, The Quest for Value, Harper Collins Publishers, 1991.